Key Metrics for the Rapidly Expanding Web3 Ecosystem
- Key Metrics for the Rapidly Expanding Web3 Ecosystem
- Highlights
- How Web3 Metrics are Evolving
- Capital Metrics For Measuring A Protocol's Economic Performance
- Developer Metrics for Assessing Web3's Production Capacity
- User Metrics for Capturing Adoption
- Ecosystem Metrics for Evaluating Web3's Real-World Impact
- An Emerging Web3 Economy
Web3 is a dynamic ecosystem that aligns founders, token holders, developers, and users to create a decentralized, user-owned Internet. In just a few short years, it’s gone from basic infrastructure and a vision for a better Internet to enabling exciting new use cases across verticals as diverse as finance, art, and supply chain management such as automated asset management, parametric insurance, and tokenized real estate.
In this article, we start by discussing why the metrics we use to measure Web3 are evolving and how a more robust set of metrics can benefit the ecosystem. We then explore specific metrics that help measure the adoption of individual protocols, compare the growth of developer ecosystems, assess user adoption, and provide estimates for the value Web3 is enabling. Ultimately, the emergence of new metrics reflects a larger trend toward building a Web3 economy increasingly interconnected with the real world.
Highlights
- If the current rate of adoption continues, Web3 could reach a billion users by 2031.
- It’s estimated that the Web3 system could disrupt $827T USD worth of value.
- Crypto user fees and transaction value enabled (TVE) are emerging as advanced metrics that provide greater insight into the Web3 ecosystem.
How Web3 Metrics are Evolving
While established Web3 metrics have proved valuable in tracking the growth of the ecosystem, participants can become over reliant on them. As markets began rewarding projects for growing established metrics like total value locked (TVL), projects were incentivized to optimize for these metrics rather than focusing on product-market fit and real-world adoption. This created the need for a more robust set of metrics—such as dApp revenue, daily active users, and transaction value enabled (TVE)—that better measure the fundamental value of a protocol.
New metrics are emerging to provide a more robust view of the dynamic Web3 ecosystem and its diverse array of participants. Capturing Web3’s multifaceted growth requires an array of different metrics that cover capital investment, developers, users, and the broader ecosystem.
Some of the underlying trends contributing to the evolution of Web3 metrics include:
- Capital—A more mature Web3 ecosystem and rising interest rates are prompting capital allocators to shift their focus toward economic sustainability around revenue generation, cost-efficiency, and overall value capture.
- Developers—Developer tooling has been built to better enable existing Web2 developers to connect with the Web3 ecosystem.
- Users—Scalability solutions are reaching a tipping point where transaction fees are becoming affordable enough to be competitive with many more Web2 services.
- Ecosystem—Core Web3 infrastructure like Chainlink is connecting the Web3 ecosystem with external systems and real-world assets.
While the following metrics don’t capture the entirety of the current state of the ecosystem, they help illustrate how it’s evolving and provide a more robust framework for evaluating the emerging Web3 economy.

Capital Metrics For Measuring A Protocol’s Economic Performance
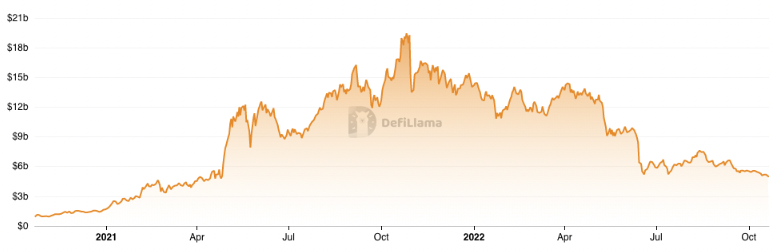
Total Value Locked (TVL)
Total value locked represents the total US dollar value of digital assets locked within a protocol. Unlike metrics traditionally used to measure app usage or growth, such as total users, TVL accounts for the amount of value a protocol manages, including high-value “whales” who often contribute a significant portion of a protocol’s liquidity.
The emergence and popularity of yield farming in the 2020 “DeFi summer” helped establish TVL as a premier Web3 metric that has been used to compare competing projects. For example, on October 21, 2020, Aave had a TVL of \$899M USD, which then rose to \$18.97B USD a year later.
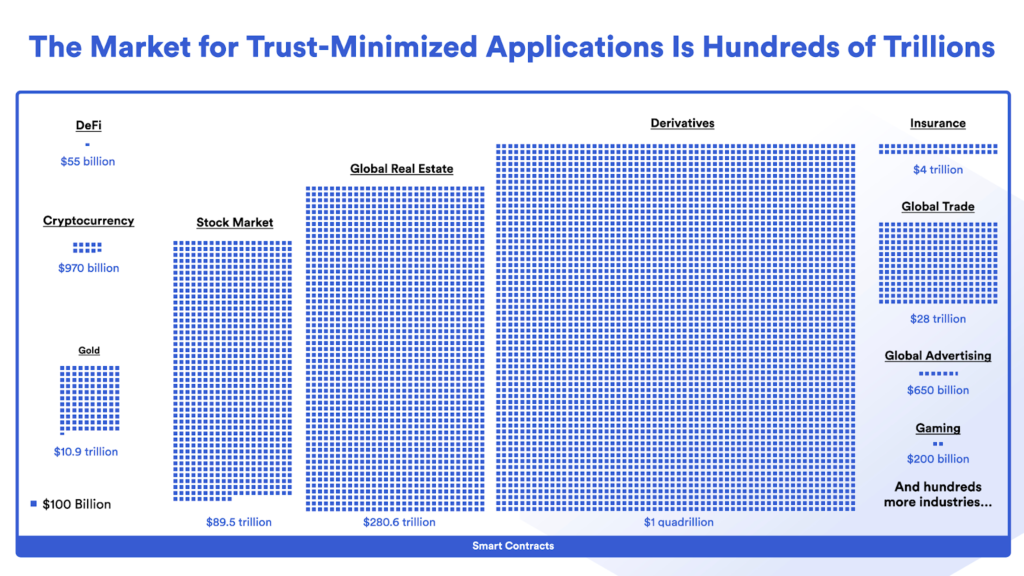
As Web3 develops, it’s important to identify real-world assets stored on-chain as this helps identify how integrated Web3 is becoming with the broader economy. Real-world value represents the total value of all assets within the global economy that are stored on-chain, such as real estate, USD-backed stablecoins, government treasuries, carbon credits, and commodities.
The World Economic Forum has estimated the Web3 system could disrupt \$827T USD worth of value across the global economy. As Web3 increasingly connects with the real world and augments traditional backend systems with more reliable and secure trust-minimized infrastructure, real-world assets can increasingly move on-chain where they can be stored more securely, be utilized in DeFi, and gain more utility.
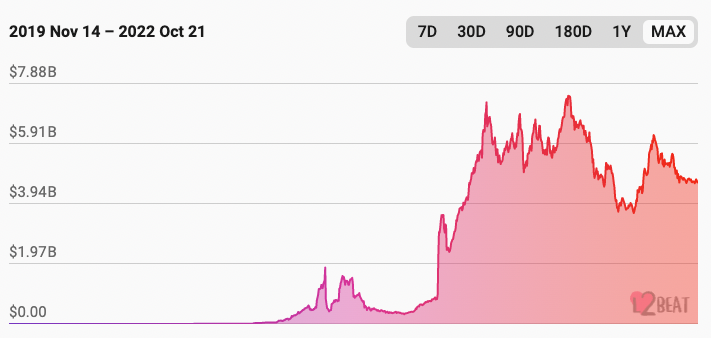
Ethereum Layer 2 TVL
Ethereum is increasingly moving from a monolithic structure where all transactions are processed on layer 1 toward a modularized execution model with dApps increasingly running on layer-2 networks like Arbitrum, Optimism, zkSync, and Starknet. Looking at the growth of layer 2 TVL highlights how scaling solutions on Ethereum are progressing and attracting liquidity.
dApp Revenue
dApp revenue is the income that a protocol earns from user fees. dApp revenue can be measured for layer-1 blockchains, infrastructure services, and dApps.
While dApp revenue isn’t a key metric for early-stage Web3 startups and growth-focused projects, it’s becoming the focus for more mature projects. As Synthetix Founder Kain Warwick said, “In my mind, crypto [user] fees is the next scoreboard.”
dApp revenue is becoming a key metric for the Web3 ecosystem for several reasons:
- It directly reflects the end-user demand for Web3-based services and identifies business use cases that are sustainable long term.
- Scalable layer-2 networks are launching with transaction fees low enough to compete with Web2 services, making revenue a key metric used to make comparisons.
- Revenue is a key input for valuation metrics used by traditional investors and strong revenue will help attract new capital into the ecosystem.
- dApp revenue drives revenue to the underlying blockchains and infrastructure services they’re built on, making it integral to the success of the entire Web3 ecosystem.
Developer Metrics for Assessing Web3’s Production Capacity
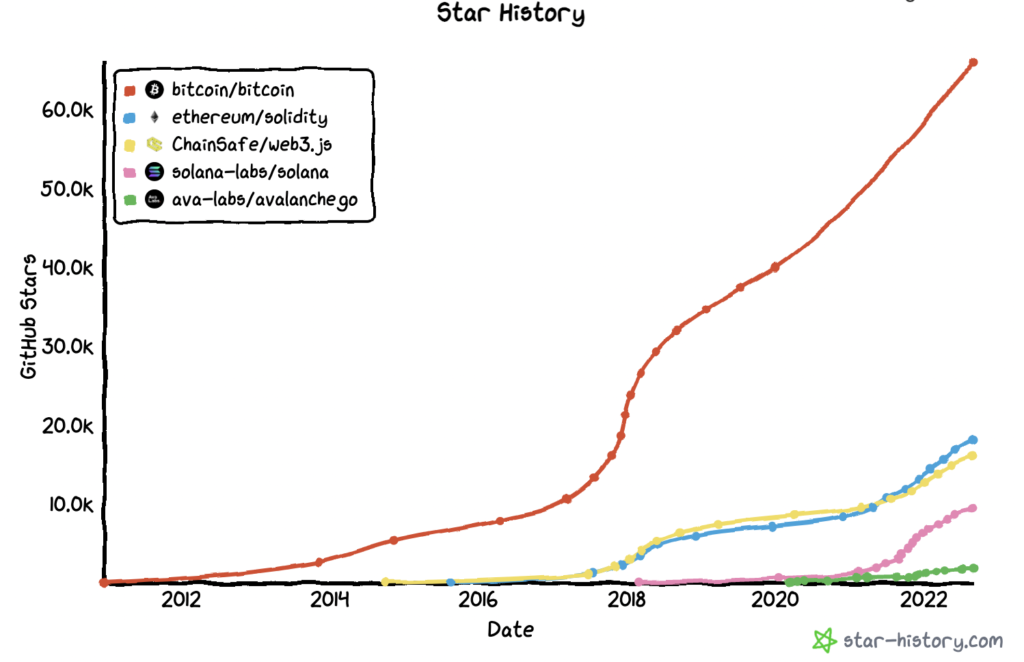
Number of GitHub Stars
GitHub users are able to “star” repositories, enabling them to bookmark a repo for later use or simply to show support for a project. In addition to stars, the number of forks and contributors on GitHub repos provides further context regarding the impact of a project.
Bitcoin, the first blockchain, has the most stars by a margin of over 300%, reflecting its strong brand awareness. A number of other chains have recently gained attention. Notably, the number of Solana repo stars (9.3K) has increased rapidly over the past year, and the repo now has over half as many as the Solidity repo (18.1K).
The growth of Web3.js repo stars is important to watch, as it helps show how many Web3 frontend developers are building in the space.
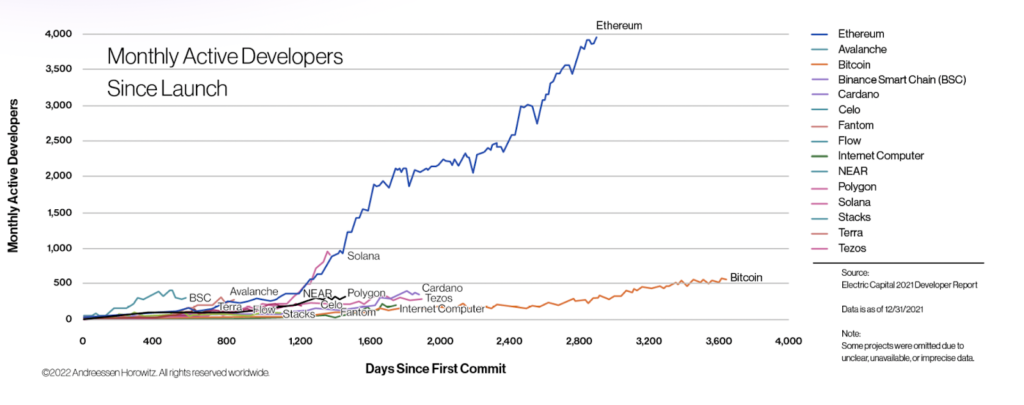
Monthly Active Developers
Total developers refers to the number of computer programmers actively working on a specific blockchain network.
As the first smart contract platform, Ethereum was home to much of the early development and innovation in the space, creating a developer community with extensive developer tooling and support which in turn helped grow the ecosystem. As the graph below highlights, Solana is following a similar trajectory to the early growth of Ethereum.
User Metrics for Capturing Adoption
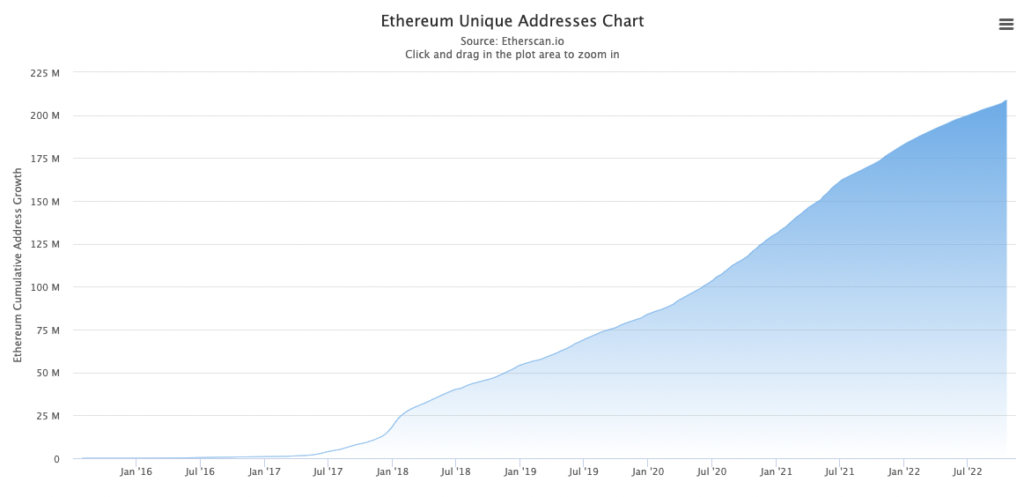
Unique Addresses
Unique addresses refers to the total number of individual addresses on a blockchain. It’s an important metric as it shows the network effects underpinning the rapid growth of Web3 and indicates how many people are being empowered by blockchain technology.
Measuring total unique addresses across all chains gives an overview of the adoption of Web3, while comparing active addresses on different chains offers insight into how different blockchain ecosystems compare against one another.
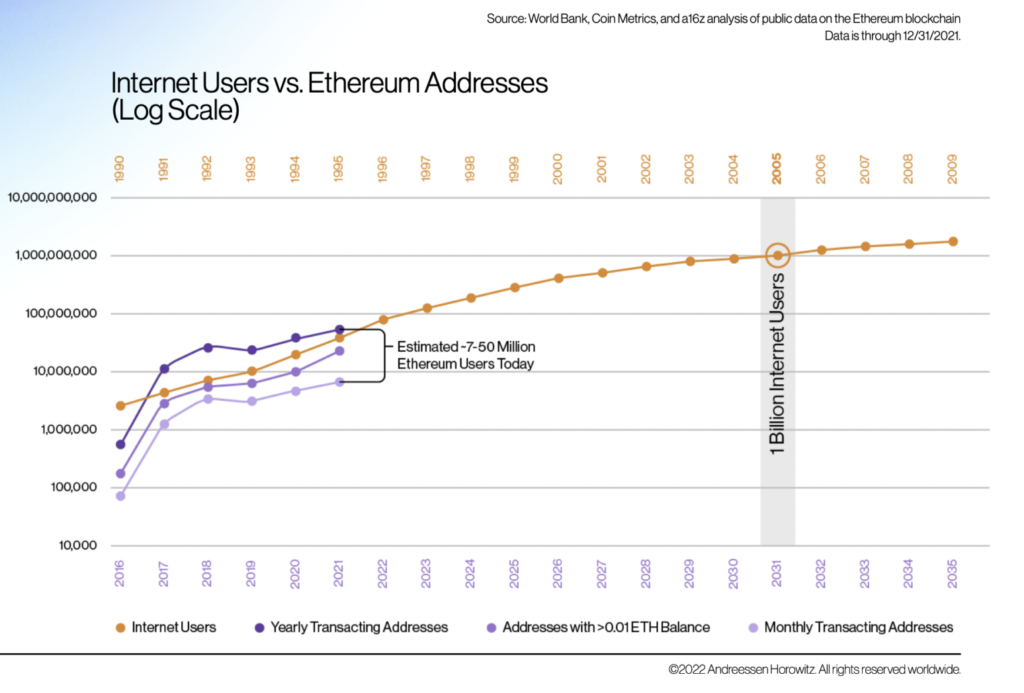
It’s also useful to compare unique addresses to the number of Internet users. As Web3 is the next step in the evolution of the Internet, participants can get an idea of future growth prospects by comparing the current number of active addresses to the number of users during earlier stages of the Internet.
As a16z highlighted in its 2022 State of Crypto report, there are an estimated 7-50M active Ethereum users today. That puts today’s level of Web3 adoption near the 1995 adoption level of the Internet. If this rate of adoption continues, Web3 could reach a billion users by 2031—a benchmark the Internet reached in 2005.
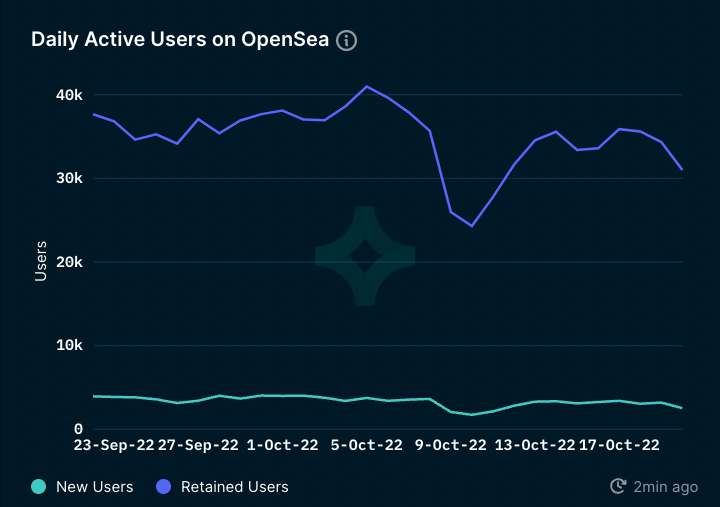
Daily Active Users
Daily active users (DAUs) refers to the number of users who are active on an application each day. While blockchain active addresses captures the growth of an entire network, daily active users helps measure the success of a specific application.
The metric helps identify which services are being adopted, enabling builders to prioritize, grow, and expand these successful use cases.
Ecosystem Metrics for Evaluating Web3’s Real-World Impact
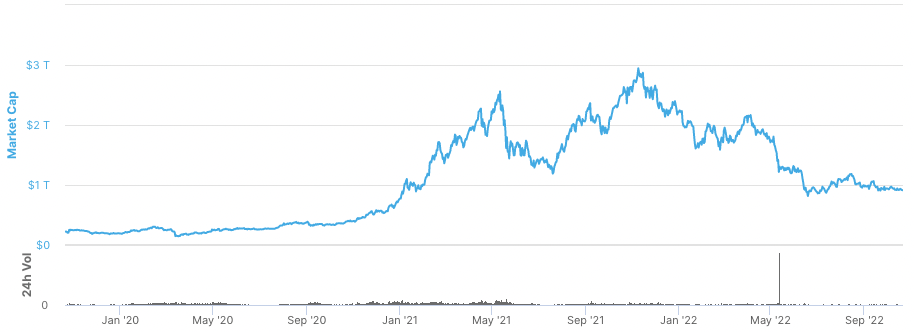
Crypto Market Capitalization
Crypto market capitalization represents the total value of coins and tokens in the Web3 ecosystem. It’s used as a general indicator of the general financial health of the space and to identify bull and bear markets. A quick glance highlights how much the space has grown in value, rising from \$17B USD at the start of 2017 to hit \$2.9T USD in November 2021.
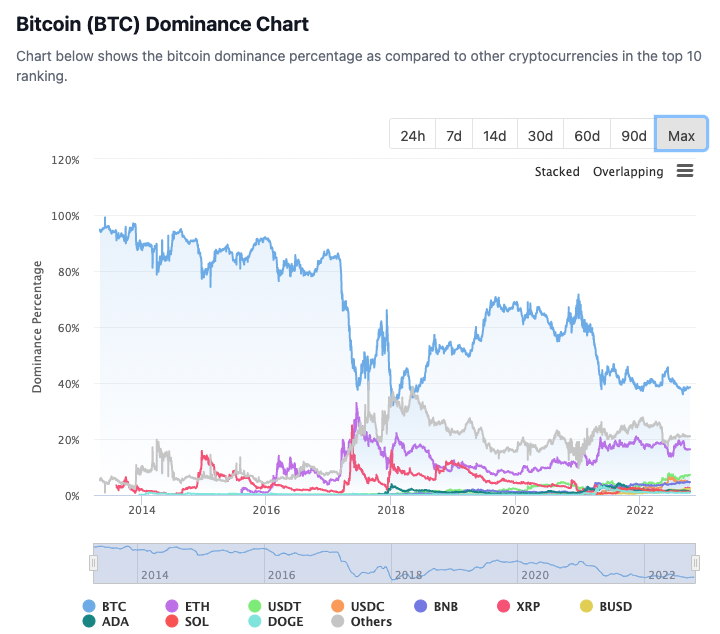
Bitcoin Dominance
The Bitcoin dominance chart shows how the crypto market cap is allocated between different coins and tokens. Even as Bitcoin itself has steadily grown, you can see that the rest of the crypto ecosystem has grown at a faster pace, creating a vibrant ecosystem. As this trend continues, so will the need for a highly secure, decentralized, and reliable cross-chain interoperability protocol.
Total Stablecoin Supply
Stablecoins are a key on-chain financial primitive, and their supply helps support growth across the DeFi ecosystem. Tokens pegged to fiat currencies give users on-chain access to an asset with inherent price stability that can be used across the Web3 ecosystem as a medium of exchange, as collateral to use in yield farming and other DeFi strategies, and much more.
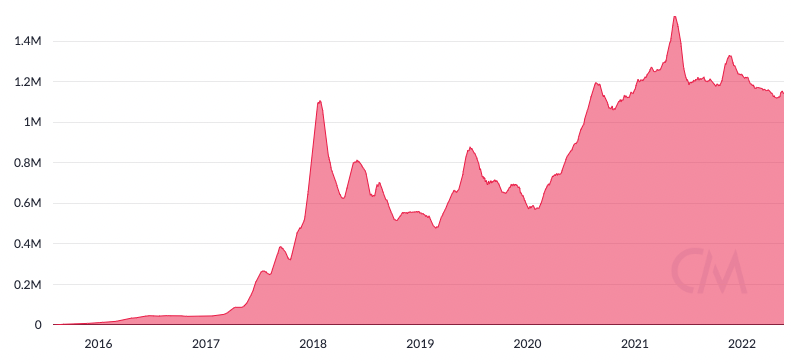
Transaction Volume
Transaction volume refers to the number of transactions made during a specific period. Within the Ethereum ecosystem, daily transactions roughly doubled from 500K to 1M between the start of 2020 to August 2022.
While crypto market cap reveals more about the financial health of an ecosystem, transaction volume indicates the ability to scale transaction throughput and achieve mass adoption. Transaction volume on layer-2 networks will become a key metric as those ecosystems continue to grow.
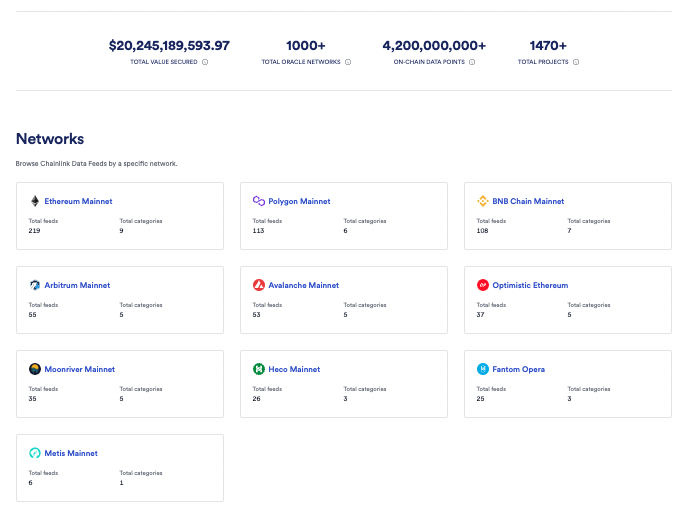
Total Value Secured (TVS)
TVS refers to the total US dollar value of assets deposited into markets secured by key infrastructure such as oracles. This includes Chainlink oracles that feed market data and other datasets on-chain, such as weather data, sports stats, Proof of Reserve, which are used by smart contracts. For example, as of October 17 2022, over a billion dollars worth of stablecoins on Compound is secured with the help of Chainlink Price Feeds—contributing to Chainlink’s overall TVS.
TVS is a key metric as oracle networks enable deterministic blockchain networks to connect to external systems and real-world economies while maintaining high standards of trust-minimization and security.
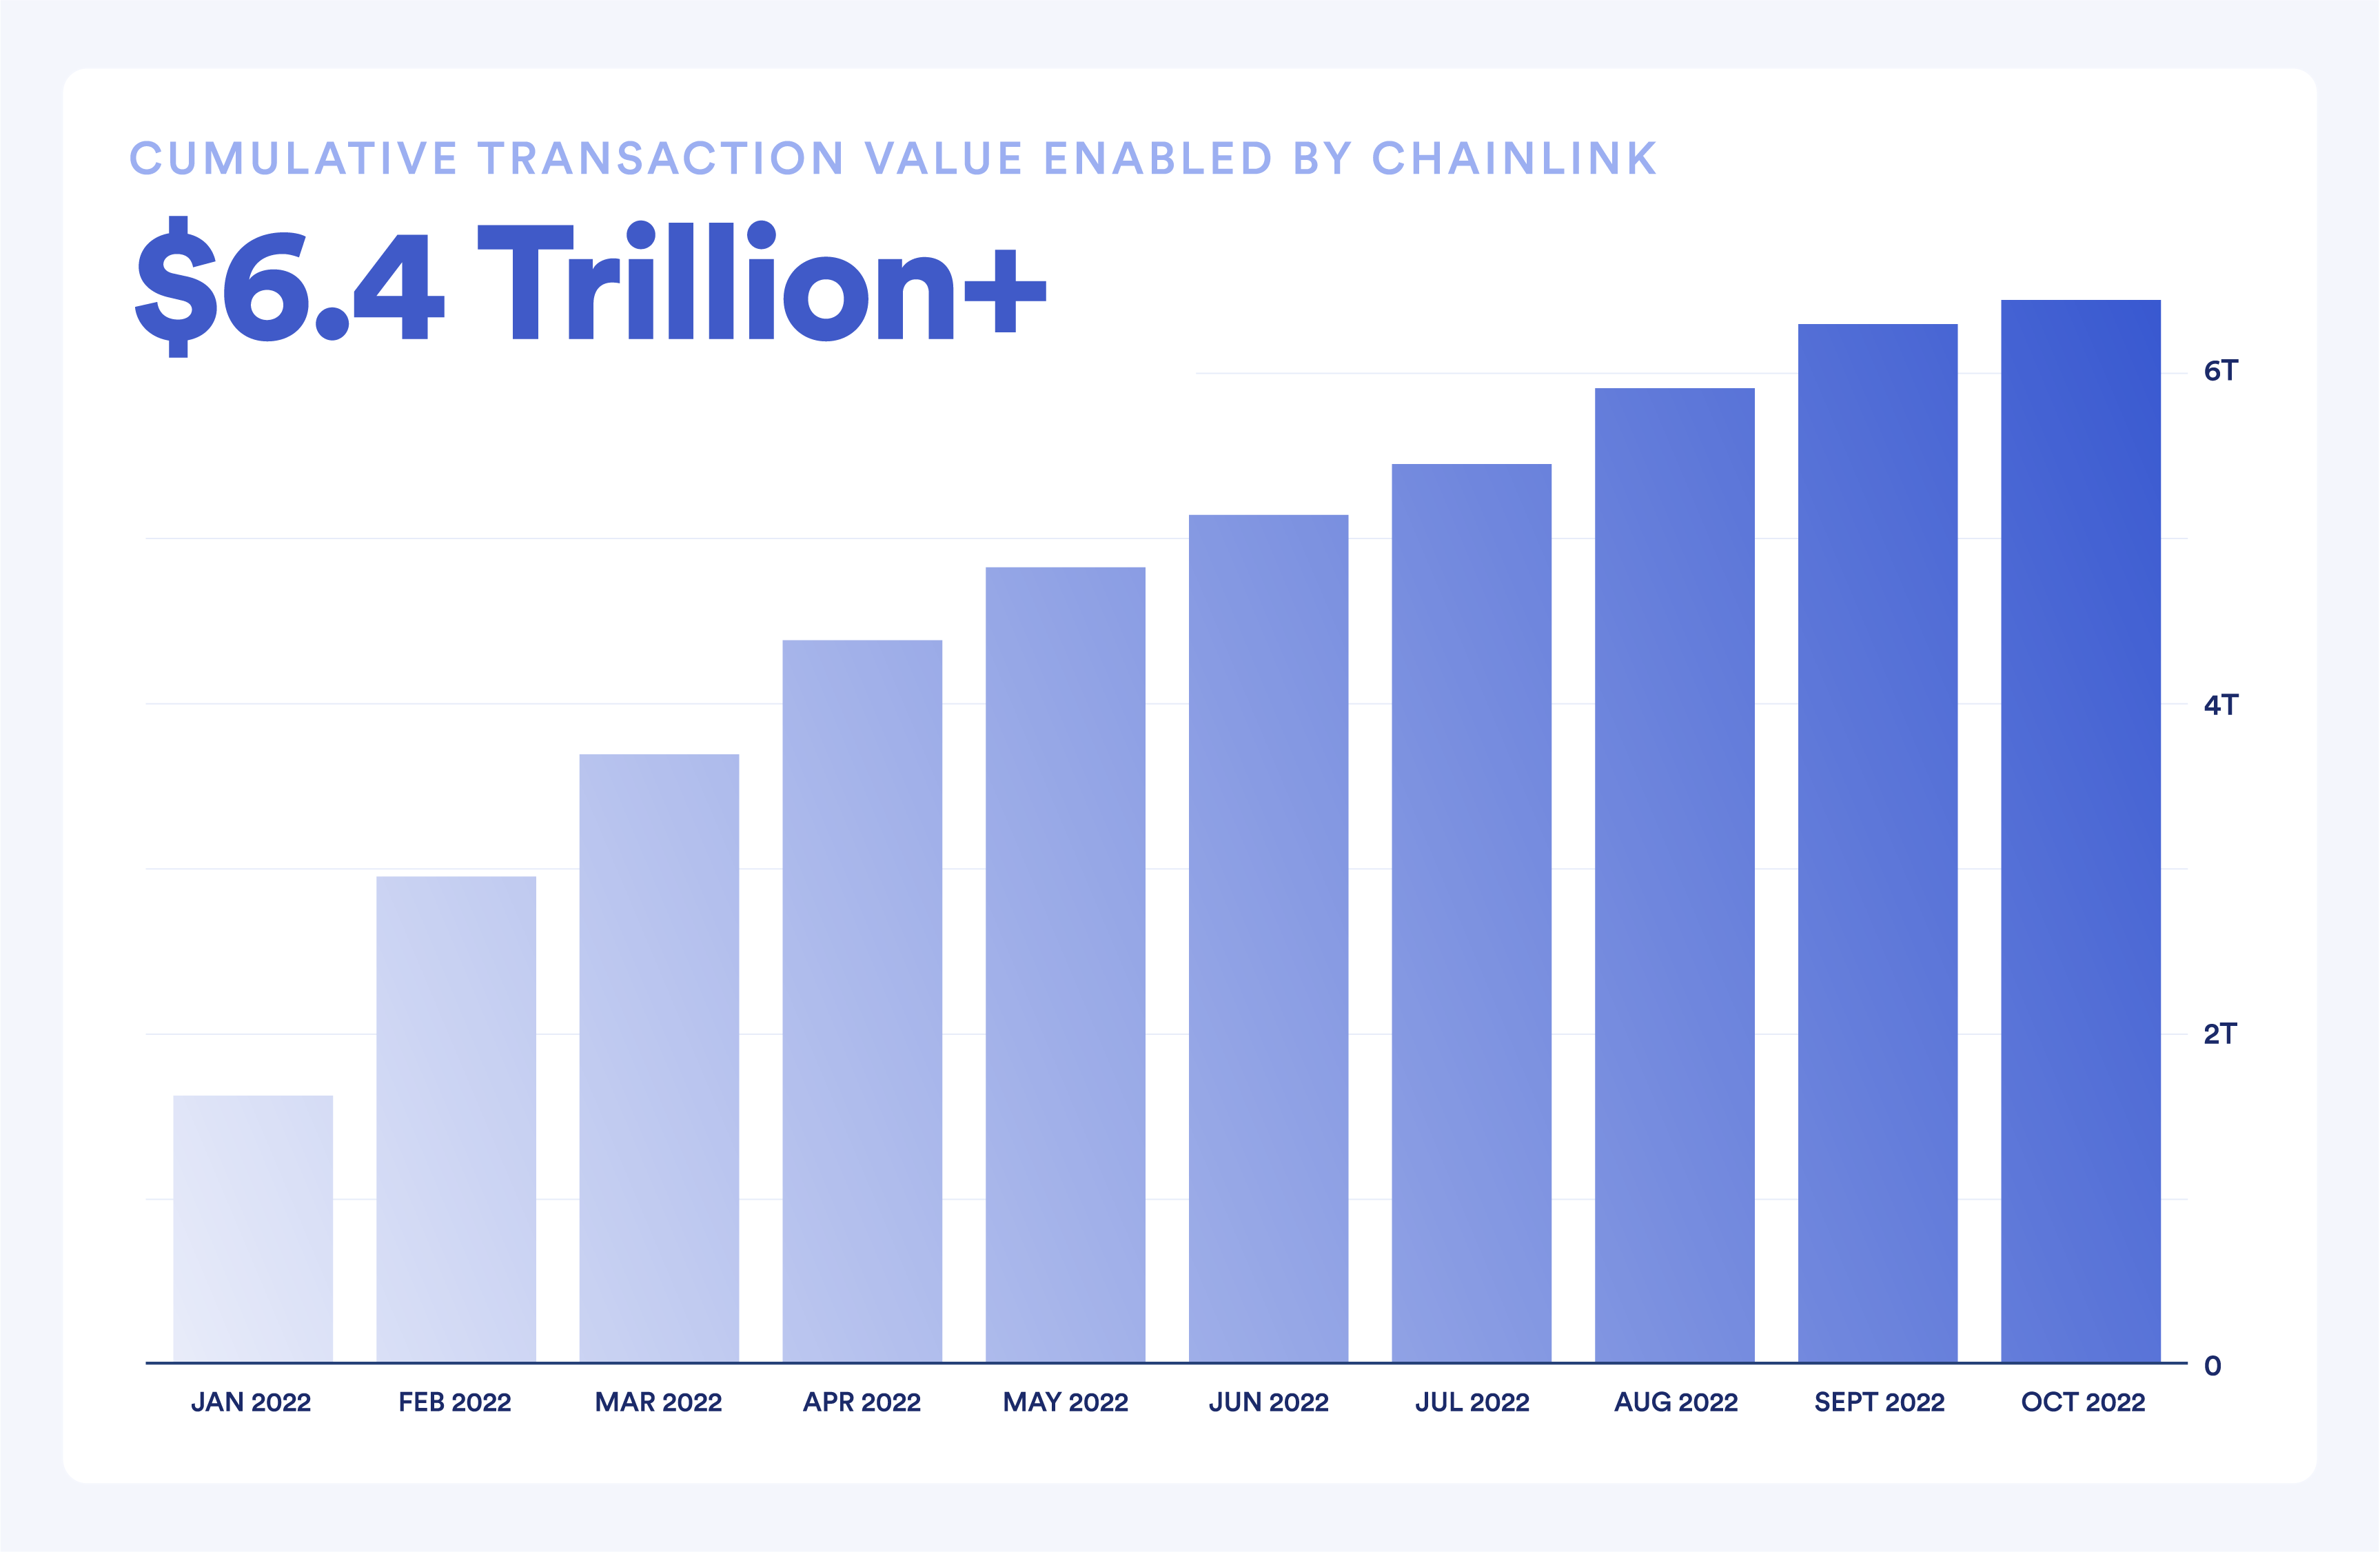
Transaction Value Enabled (TVE)
Transaction value enabled (TVE) is a Web3 metric that measures the aggregate monetary value of transactions facilitated by a protocol over a given time period. TVE is calculated by taking the sum of the USD value associated with each transaction that passed through a protocol during a given period. For example, if someone borrows \$100 USD worth of ETH on Aave and a Chainlink Price Feed is used to find the price, then the TVE of the transaction would be \$100 USD.
While TVS serves as a snapshot of value secured by key Web3 infrastructure at a particular moment, TVE is a flow metric that captures the value of activities across a period of time. Ultimately TVE is an advanced metric that provides more meaningful insights into the Web3 ecosystem.
An Emerging Web3 Economy
The evolution of Web3 has seen projects kickstart their growth through various incentivization models that attract developers, enable them to build next-generation applications, bring in users, and ultimately capture more value. Through this virtuous cycle of growth, the Web3 ecosystem continues to grow. More broadly, the growth of Web3 has followed a path similar to that of nation-state emerging economies. The industry attracted capital which enabled it to build core infrastructure and develop productive capacity. Now it’s ready to rapidly expand into new markets.
Chainlink decentralized oracle networks are playing a key role in this growth as they seamlessly and securely connect smart contracts with the real world, enabling Web3 ecosystems to transact with mature industries in developed markets across the globe. As Chainlink trust-minimized services underpin so much of the Web3 economy, Chainlink’s Transaction Value Enabled (TVE) will be a key Web3 metric that helps provide an insight into the overall impact of Web3 across the world economy.


