Liquidity Indicators: Improving Risk-Management in DeFi
Price oracles play a critical role in DeFi, providing the financial market data that smart contracts require to execute key backend functions. For instance, price oracles enable lending markets to value collateral and debt when issuing loans and determining liquidations. They also allow derivatives platforms to determine execution prices and compute users’ profits and losses (PnL) from trades.
As the industry standard price oracle solution, Chainlink Price Feeds are widely used throughout DeFi as the market-wide benchmark price for various cryptocurrencies, commodities, and fiat currencies. Backed by multiple layers of decentralization and with a long history of strong security and reliability, Price Feeds enable developers to confidently build decentralized applications that depend on being in sync with current asset prices.
While benchmark prices have gotten DeFi off the ground, additional data points are required for the ecosystem to expand, most notably data describing the current liquidity conditions of various assets. We refer to these as liquidity indicators, and they can help protocols protect against insolvency and other risks, as well as improve their user experience.
In this blog, we explore the role of asset liquidity in financial markets and DeFi before introducing the research and development being performed around Chainlink Liquidity Indicators and diving into how these indicators can support the next evolution in DeFi’s maturity.
Overview of Asset Liquidity in Financial Markets
Asset liquidity refers to the market’s ability to absorb the buying/selling of an asset in a given period of time and the associated change in market price after such trades (i.e., market impact). While sometimes conflated with slippage—the difference between the expected price of a trade and the actual price when its executed—market impact is in fact the change in the price of an asset caused by the trading of that asset (i.e., the difference in market price before and after the trade).
An illiquid asset will have a higher market impact from buy/sell trades, resulting in poor price execution when the asset is bought or sold in large amounts. Conversely, a highly liquid asset will have a lower market impact, meaning significant buy/sell trades can be absorbed by markets with minimal change in the asset’s price.
Asset liquidity can be measured in different ways by using different attributes of the market’s orderbook. An orderbook is simply the list of standing buy and sell orders for a specific asset organized by price level.
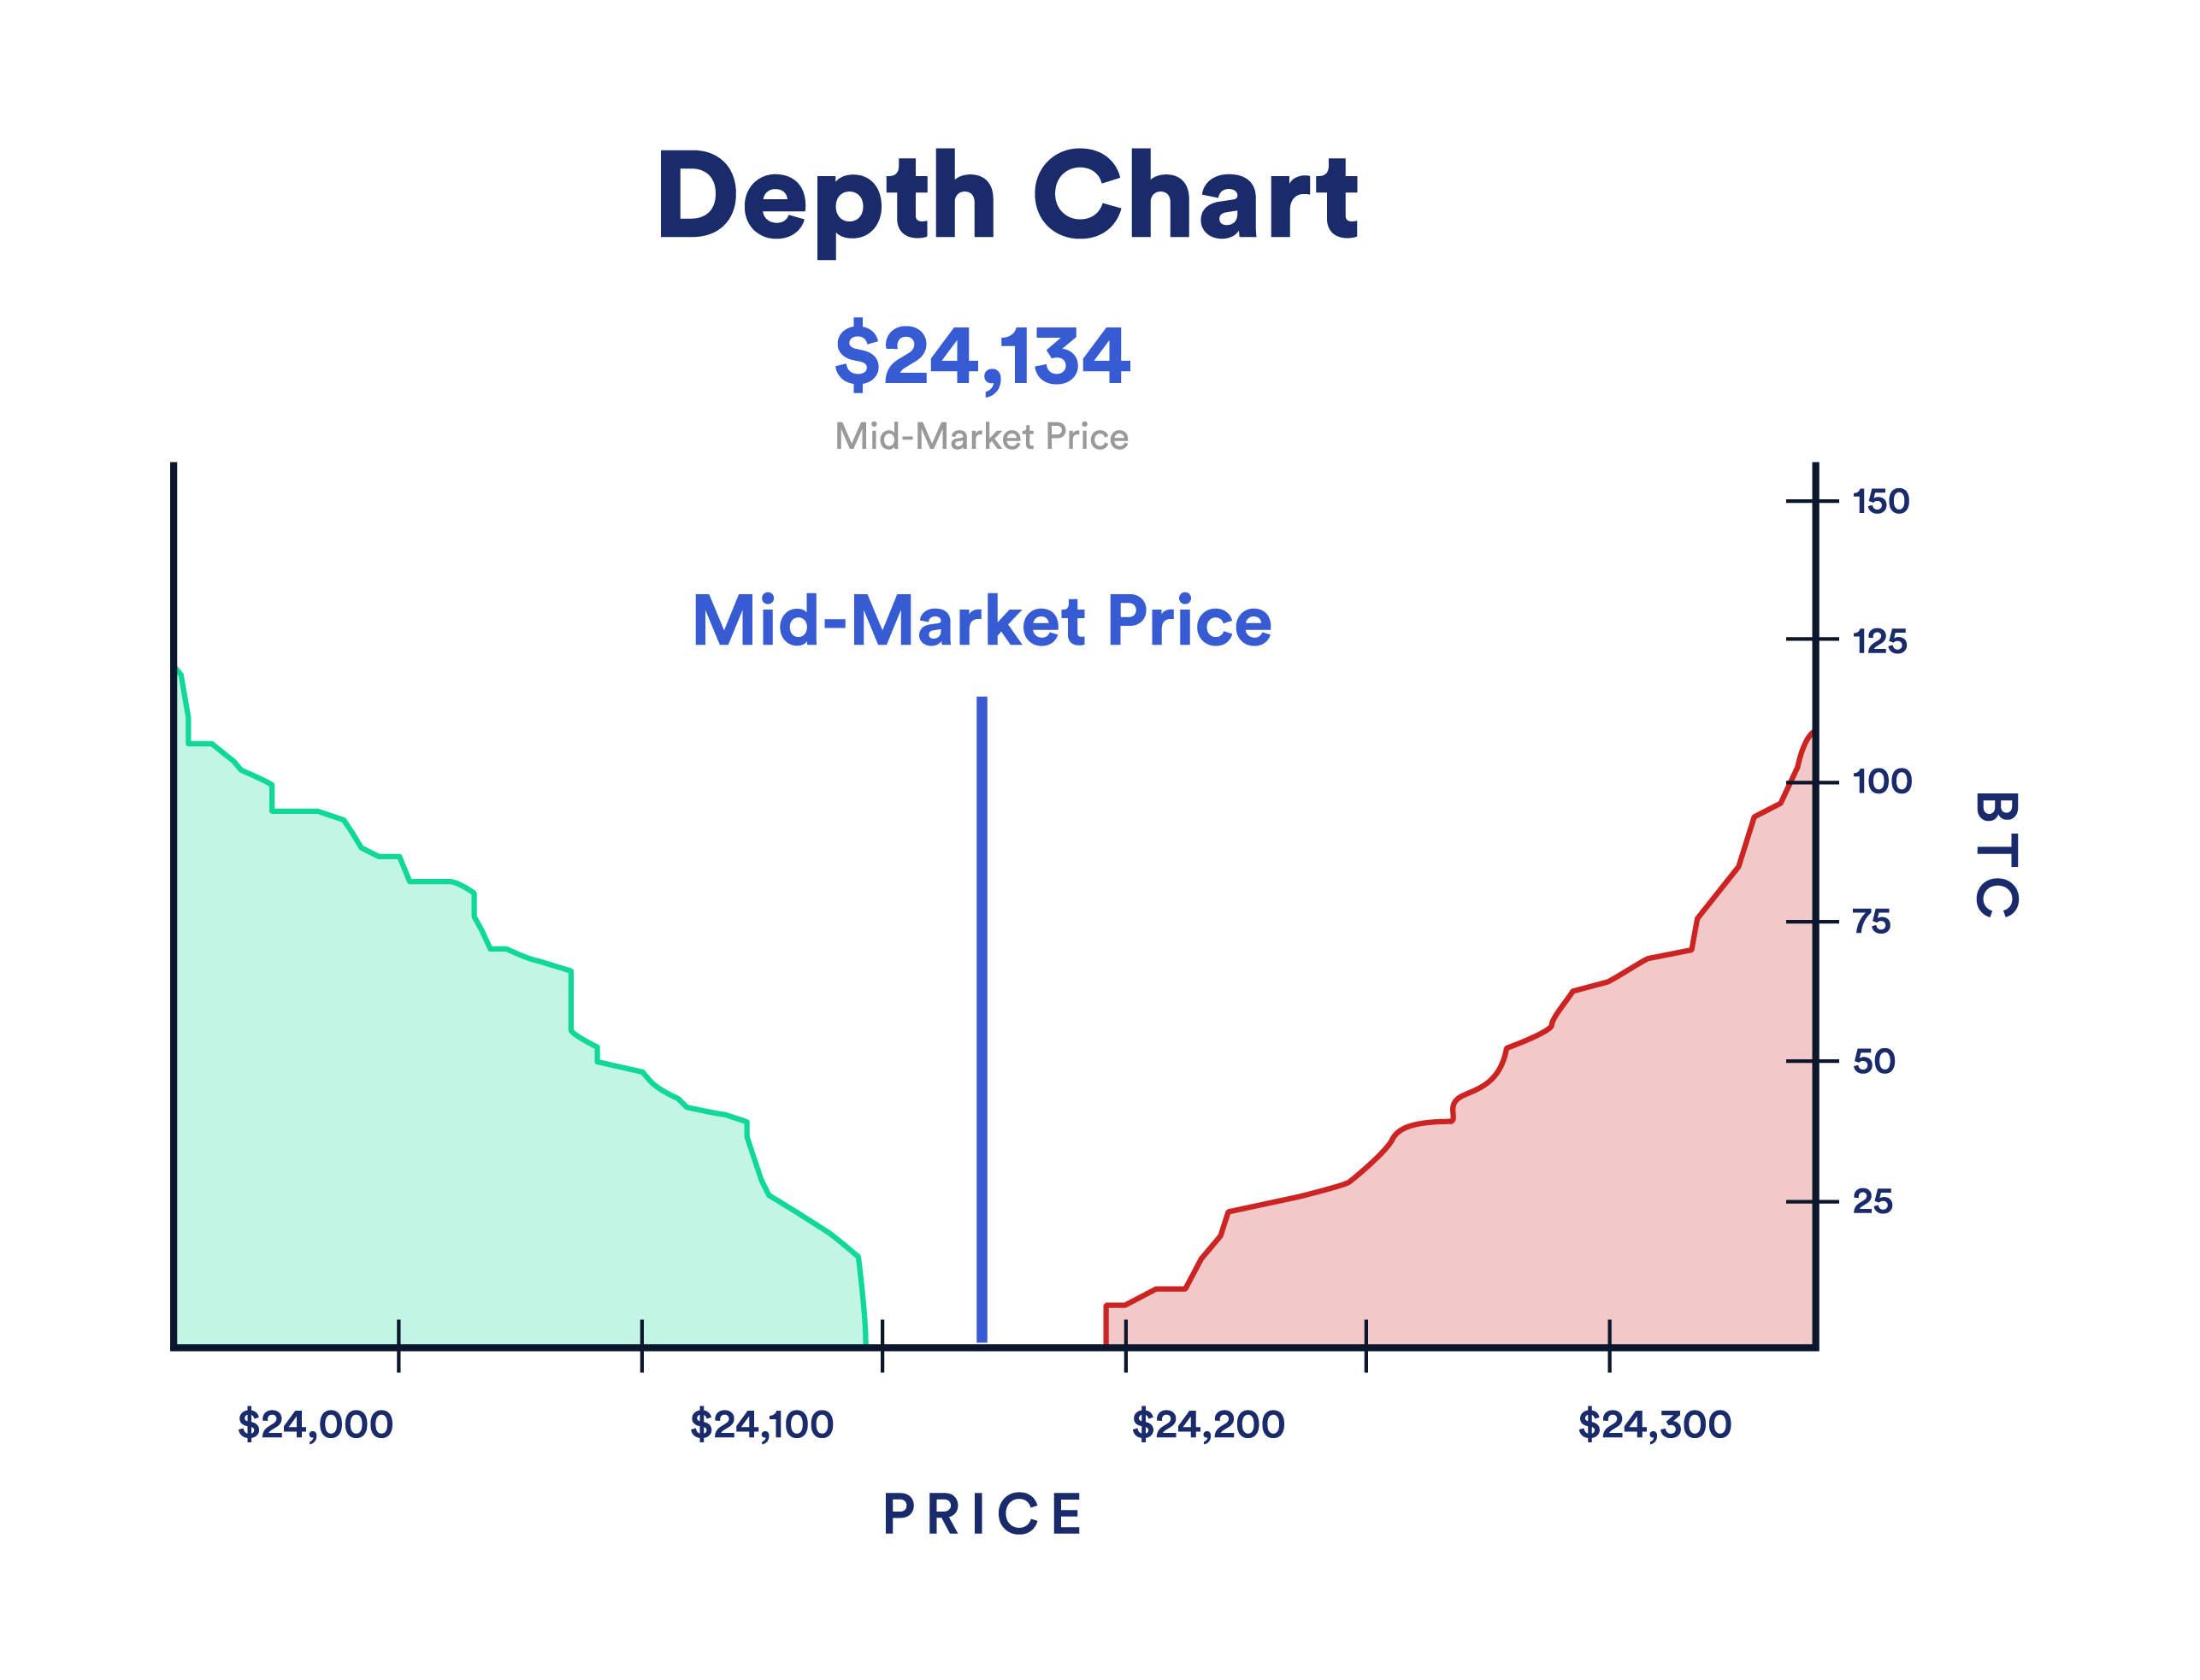
- Market Depth: The market’s ability to absorb relatively large market orders without the price of the asset being significantly impacted. Market depth is commonly measured by how much of an asset needs to be sold/bought to move the price a certain percentage. For example, a +-2% market depth of \$1M means buying or selling \$1M of the asset will move the market price up or down by 2%. A more liquid market will have a larger market depth, with more capital required to move the market price by a certain percentage.
- Bid/Ask Spread: The difference between the prices quoted for an immediate sale and an immediate purchase of an asset. A simple way to think about this is the difference between the highest price a buyer is willing to pay for an asset and the lowest price that a seller is willing to accept. The average between the best bid and ask prices being quoted is referred to as the mid-market price. The tighter the bid/ask spread, the greater the market liquidity, and vice versa. The spread is often used as a measure for market liquidity.
Because the liquidity conditions of an asset can rapidly change across exchanges, asset liquidity has a large impact on building financial markets for assets that depend on a certain amount of liquidity existing. More specifically, asset illiquidity (low market depth and wide bid/ask spread) creates an issue for financial markets because it becomes cheaper to engage in market manipulation—when an asset’s price is artificially manipulated by skewing natural supply and demand forces. For example, when an illiquid asset is used as collateral for a loan, market manipulation can result in an artificially greater amount being borrowed or false liquidation, creating toxic debt and losses for lenders.
It is no different when it comes to DeFi.
Asset Liquidity Data in DeFi
In order for DeFi protocols to evaluate the risk of market manipulation, they need on-chain access to liquidity data that exists off-chain. Liquidity indicator data must take into account the broader market’s liquidity for an asset, encapsulating off-chain exchanges such as Binance and Coinbase along with other venues where financial assets are commonly traded.
Liquidity indicators can be in the form of market depth, which provides an estimate regarding how much of an asset needs to be bought/sold to move the market by a certain percentage. Alternatively they can take the form of a bid/ask spread indicator, which provides the prevailing bid/ask quote prices across the broader market for an asset.
With this data made available on-chain alongside benchmark prices, DeFi protocols can finetune their business logic to dynamically adjust key parameters such as loan-to-value (LTV) ratios, supply/borrow caps, liquidation premiums, leverage caps, and trade spreads. Different protocols can leverage this data in unique ways in order to protect against market manipulation, optimize capital efficiency, and improve the user experience.
Chainlink’s Approach to Liquidity Indicators
Based on user demand, we are actively engaged in research and development around liquidity indicator solutions that are planned to be supported by the upcoming low-latency oracle solution. The initial implementation is focused on supporting DeFi derivatives use cases, where high latency, frontrunning, and market manipulation are key problems to solve, but can be extended to other use cases as well. To support this solution, we are currently working with premium data providers that have deep knowledge in liquidity measurement and insight into the market structure of digital assets.
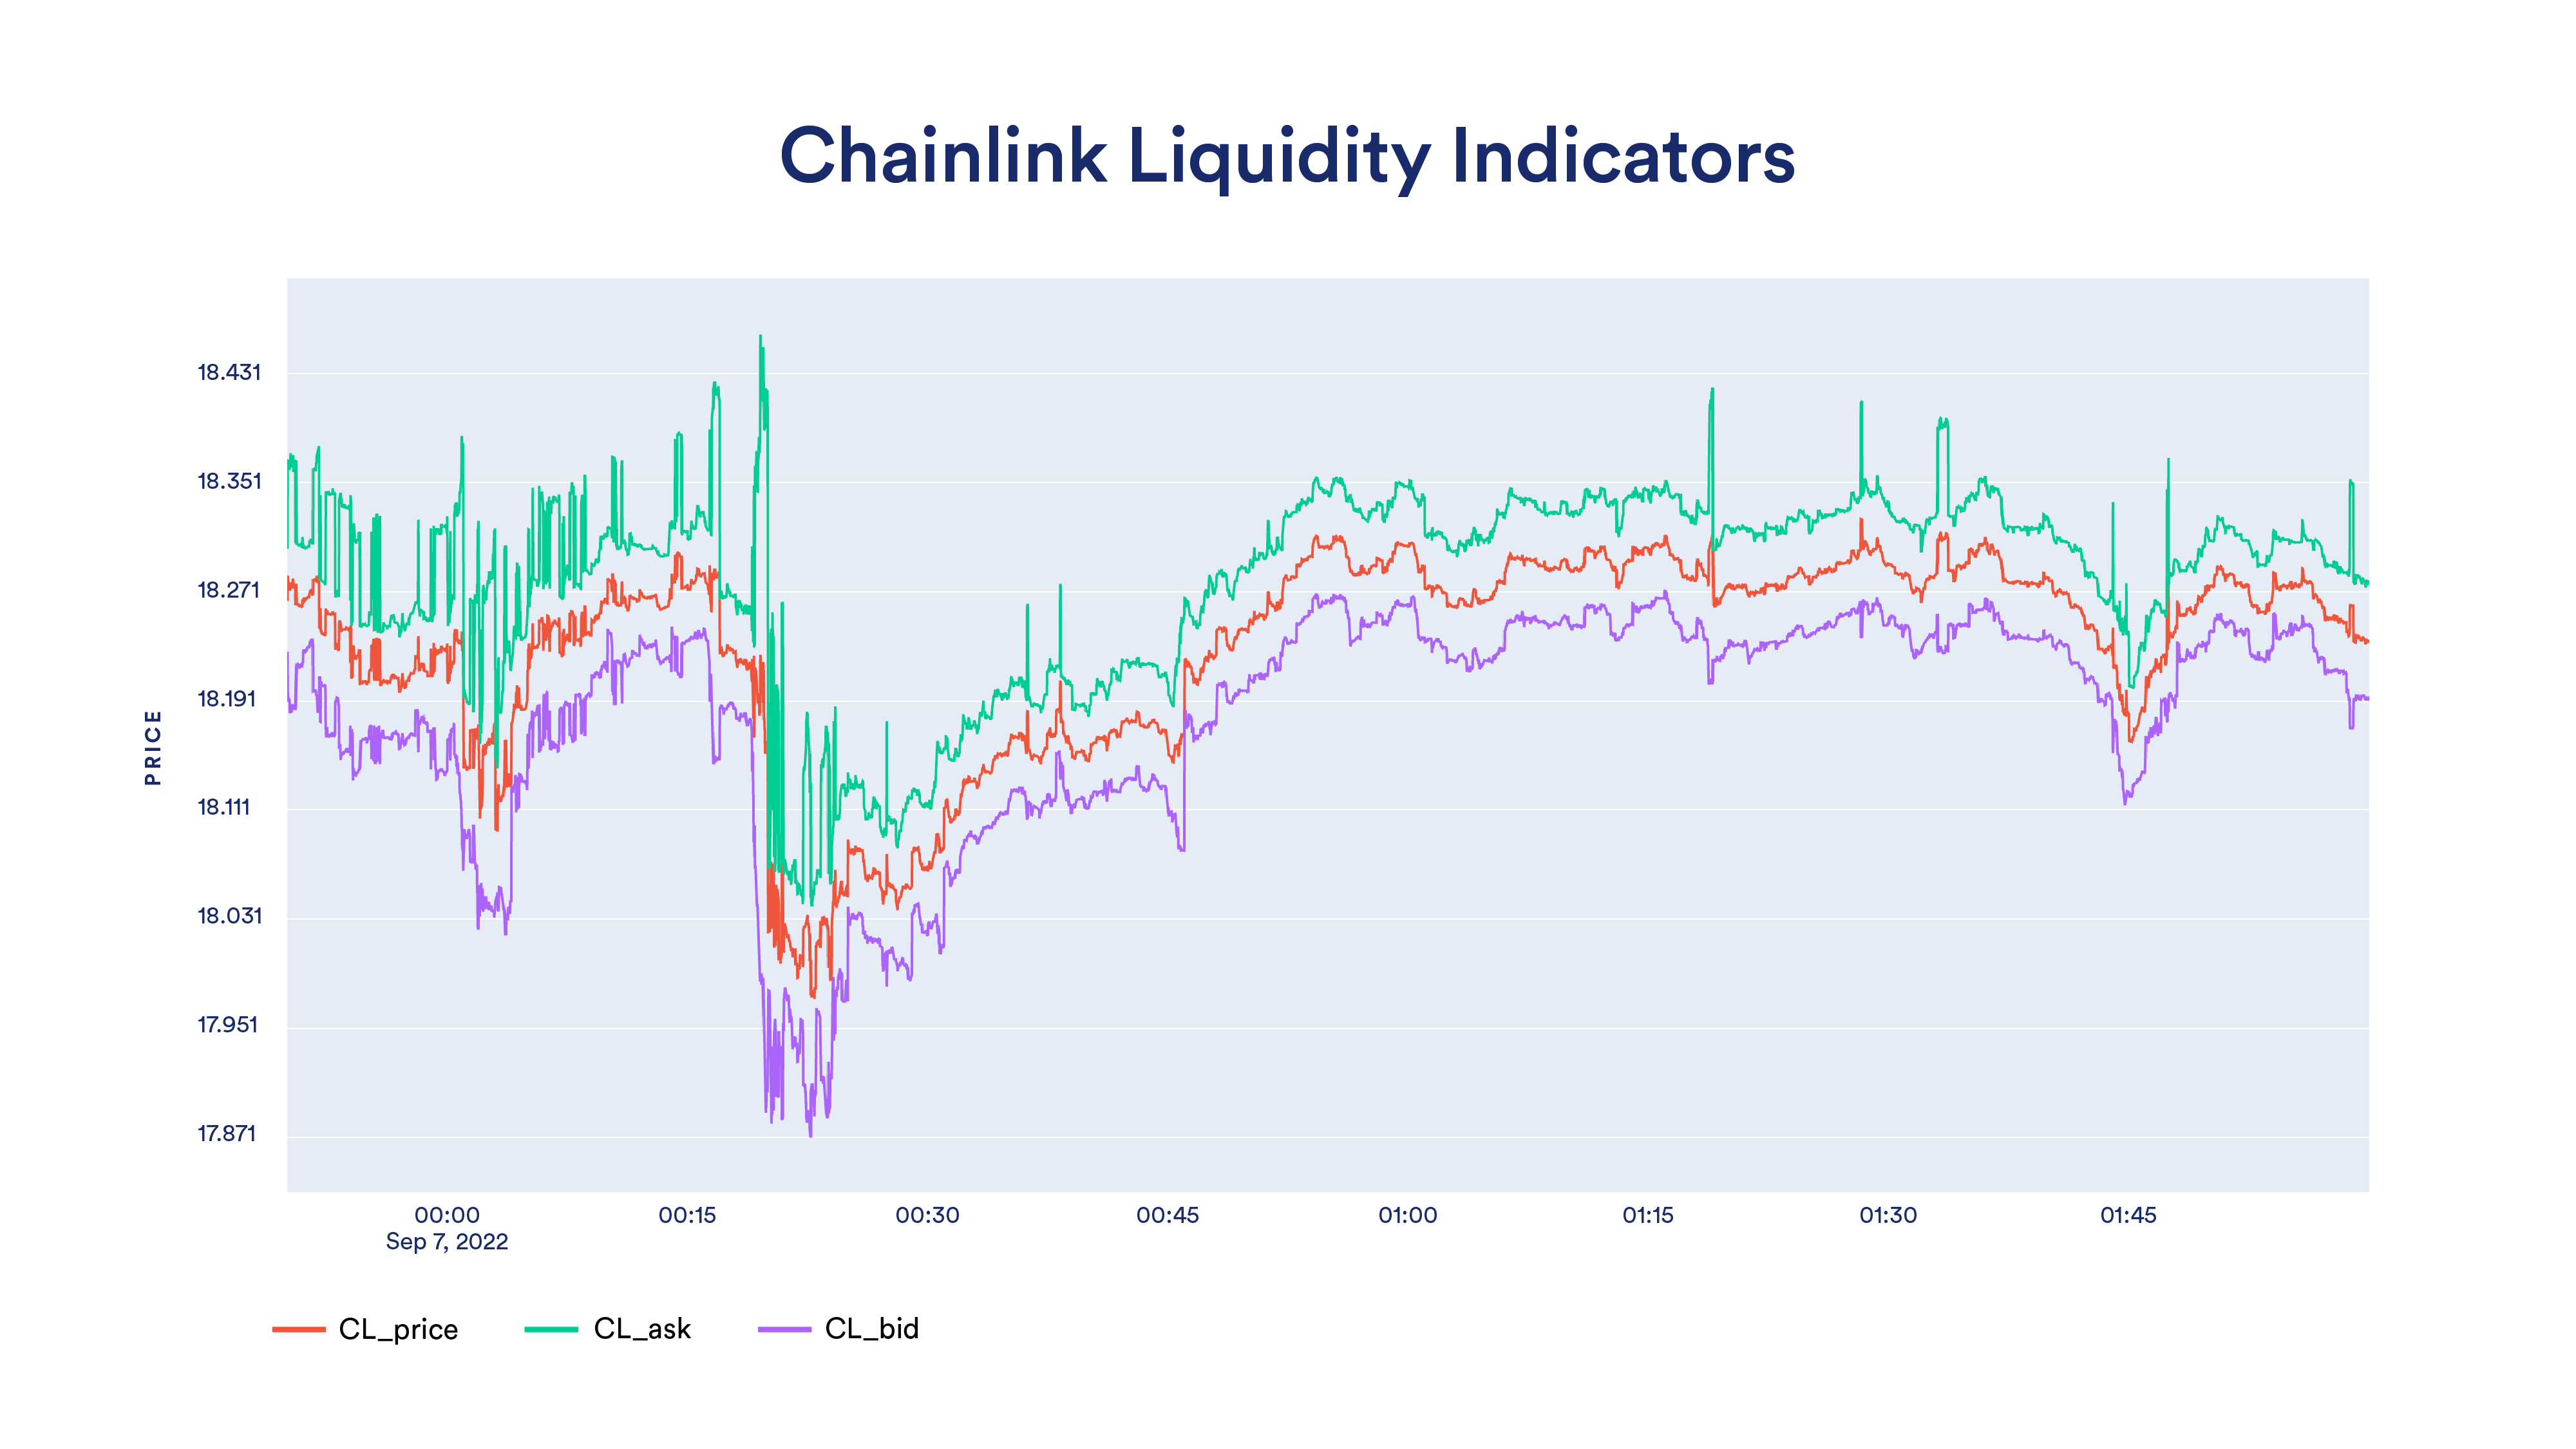
The initial implementation of Chainlink Liquidity Indicators is planned to take the form of liquidity-weighted bid/ask quote prices calculated and published at the same time as the benchmark price. The two additional data points—CL_ask and CL_bid—tell the prevailing prices on the bid and ask sides of the aggregate market and how far away they are from the benchmarked CL_price value. These additional data points are representative of the liquidity conditions in the market, both in terms of the tightness of the bid/ask spread and the balance of the benchmark price (i.e. whether the benchmark price is closer to the ask or bid side).
Chainlink Liquidity Indicators offer a number of key advantages over alternative approaches:
- Synchronous: The prevailing bid and ask data points are computed and made available at the same time as the benchmark price. This allows the liquidity metadata to be used when it’s most relevant, preventing delayed or disjointed judgment compared to if the data points were published separately from the benchmark price.
- Directionality: With separate data points for the asset’s prevailing bid and ask price on the broader market, dApps can detect in which direction market liquidity is skewed. This allows risk mitigation actions to be taken for trades in that direction (e.g., capping the amount of leverage that new positions can take).
- Market Coverage: The bid and ask data points are liquidity-weighted and take into account broader market liquidity for assets by aggregating bid/ask data across a wide range of off-chain orderbooks. This provides a diverse picture of market conditions.
- Low-Latency: Liquidity Indicators are planned to be built on the low-latency oracle architecture so users get granular insight into the continuously evolving liquidity conditions of assets. This allows for real-time risk mitigation actions to be taken by dApps.
We are also exploring future expansions to Chainlink Liquidity Indicators, such as taking into account order sizes and the market impact of different order sizes (price impact changes based on order size since orderbooks don’t typically have linear buy/sell walls). Furthermore, we are also exploring the creation of Price Risk Indicators (PRI) to provide a measure of the technical uncertainty of price values being reported (e.g., deviations between data providers). PRI would serve as a complementary technical risk metric to market risk indicators.
Liquidity Indicators Usage in DeFi
Different types of DeFi protocols can leverage Chainlink Liquidity Indicators to automatically adjust the behavior of their coded risk logic and detect abnormal liquidity events that may impact the platform’s UX.
Derivatives Markets
Derivatives platforms that offer leveraged perpetual markets use price data from Chainlink oracles to determine the cost of opening a short/long position and the amount of profit or loss (PnL) a position has made upon settlement. In addition to knowing the price at which to open and close positions, such platforms also need to take into account the market liquidity of assets in order to cap the size and number of positions that can be opened at any given time. If the liquidity indicators show the bid/ask spread is widening or increasing in a certain direction for a specific asset (indicating an environment with reduced liquidity), the maximum number of perpetual positions in that market can be capped in a certain direction (e.g., long or short) to mitigate potential losses for liquidity providers.
Furthermore, with perpetual positions priced based on the spot markets, there is a risk that the underlying spot market could be manipulated by a malicious actor in order to extract value from the platform’s liquidity providers. Chainlink Liquidity Indicators can help derivatives protocols dynamically adjust the spread for opening new long/short positions by providing the current aggregate market’s prevailing bid/ask spread. This helps mitigate the risk of excessively large positions being taken on illiquid assets.
Lending Markets
A similar approach can be employed by lending markets—platforms where users can borrow assets against deposited collateral. DeFi lending markets use price data from Chainlink oracles to determine max loan sizes and when liquidation events should occur. However, such protocols need to also set additional values such as the LTV ratio (which determines how much can be borrowed against a particular asset as collateral), maximum deposit/borrow caps, and the liquidation bonus for supported assets.
While such parameters are often set manually by a DAO, Chainlink Liquidity Indicators can allow these protocols to dynamically adjust such values based on prevailing liquidity conditions. This would help ensure liquidations are profitable enough to take place (as liquidators won’t liquidate a position otherwise). For example, if liquidity indicators showcased the liquidity of a asset reducing over time, then the LTV can be dynamically reduced (limiting how much can be borrowed against that asset), the deposit cap can be reduced (limiting protocol exposure), and the liquidation bonus can be adjusted (increasing the probability of successful liquidations while mitigating the risk of a toxic liquidation spiral). The combination of these tactics can help protect lenders and the protocol from incurring toxic debt, especially as liquidity conditions evolve over time.
The introduction of Chainlink Liquidity Indicators will provide the DeFi ecosystem with access to additional high-quality data points that further the ability of protocols to manage risk and keep user assets secure. If you are a DeFi developer and are interested in integrating Liquidity Indicators or providing feedback on its development, we recommend you reach out below to signal your interest for low-latency oracles.
To learn more about Chainlink, subscribe to the Chainlink newsletter and follow the official Chainlink Twitter to keep up with the latest Chainlink news and announcements.


